
Machine Learning: Introduction and Core Algorithms
Beginner-friendly introduction to machine learning, covering key concepts, model types, supervised and unsupervised learning, and essential algorithms such as linear regression, logistic regression, decision trees, and clustering.
Machine Learning 🤖
AI
AI is the field of study of "intelligent agents": any device that perceives its environment and takes actions that maximize its chance of successfully achieving its goals
ML
ML is the study of computer algorithms that improve automatically through experience.
- ML is Subset of AI
- Learning from data
- Improving performance (P) with experience(E) while performing Task (T)
Older definition -- Arthur Samuel (1959)
The field of study that gives computers the ability to learn without being explicitly programmed.
Modern definition -- Tom Mitchell (1998)
A program learns from:
E(Experience)- User-labeled emailsT(Task) - Classify emails as spam or not spamP(Performance measure) - Fraction of correctly classified emails
If performance on task T, measured by P, improves with experience E, then it is learning.
Use Cases
ML is powerful when:
1. Large Datasets Exist
- Web Analytics data
- Medical records
- Biological data
2. Problems Are Hard to Hand-Code
- Autonomous Drive
- Handwriting recognition
- NLP(Natural Language Processing)
- Computer vision
3. Self-Customizing Systems
- Amazon recommendations
- Netflix recommendations
Machine Learning Methods
1. Supervised Learning 🗂️
You give the algorithm input data and the correct outputs (“right answers”), and it learns to predict outputs for new inputs.
Training set:
- You are given labeled data.
$x^{(i)}, y^{(i)}$
where:
- → input features
- → output label
Goal: Learn a function that maps inputs → outputs.
Example:
- Find a decision boundary separating positive and negative examples.
- Spam filtering with labeled emails
- Diabetes classification with labeled patients
- Cancer Type Prediction
1.1 Regression 🎢
Regression means predicting a continuous value output.
Algorithms studied:
- Linear Regression
- Logistic Regression
- Neural Networks
- Support Vector Machines (SVM)
These methods learn a function:
used for prediction or classification.
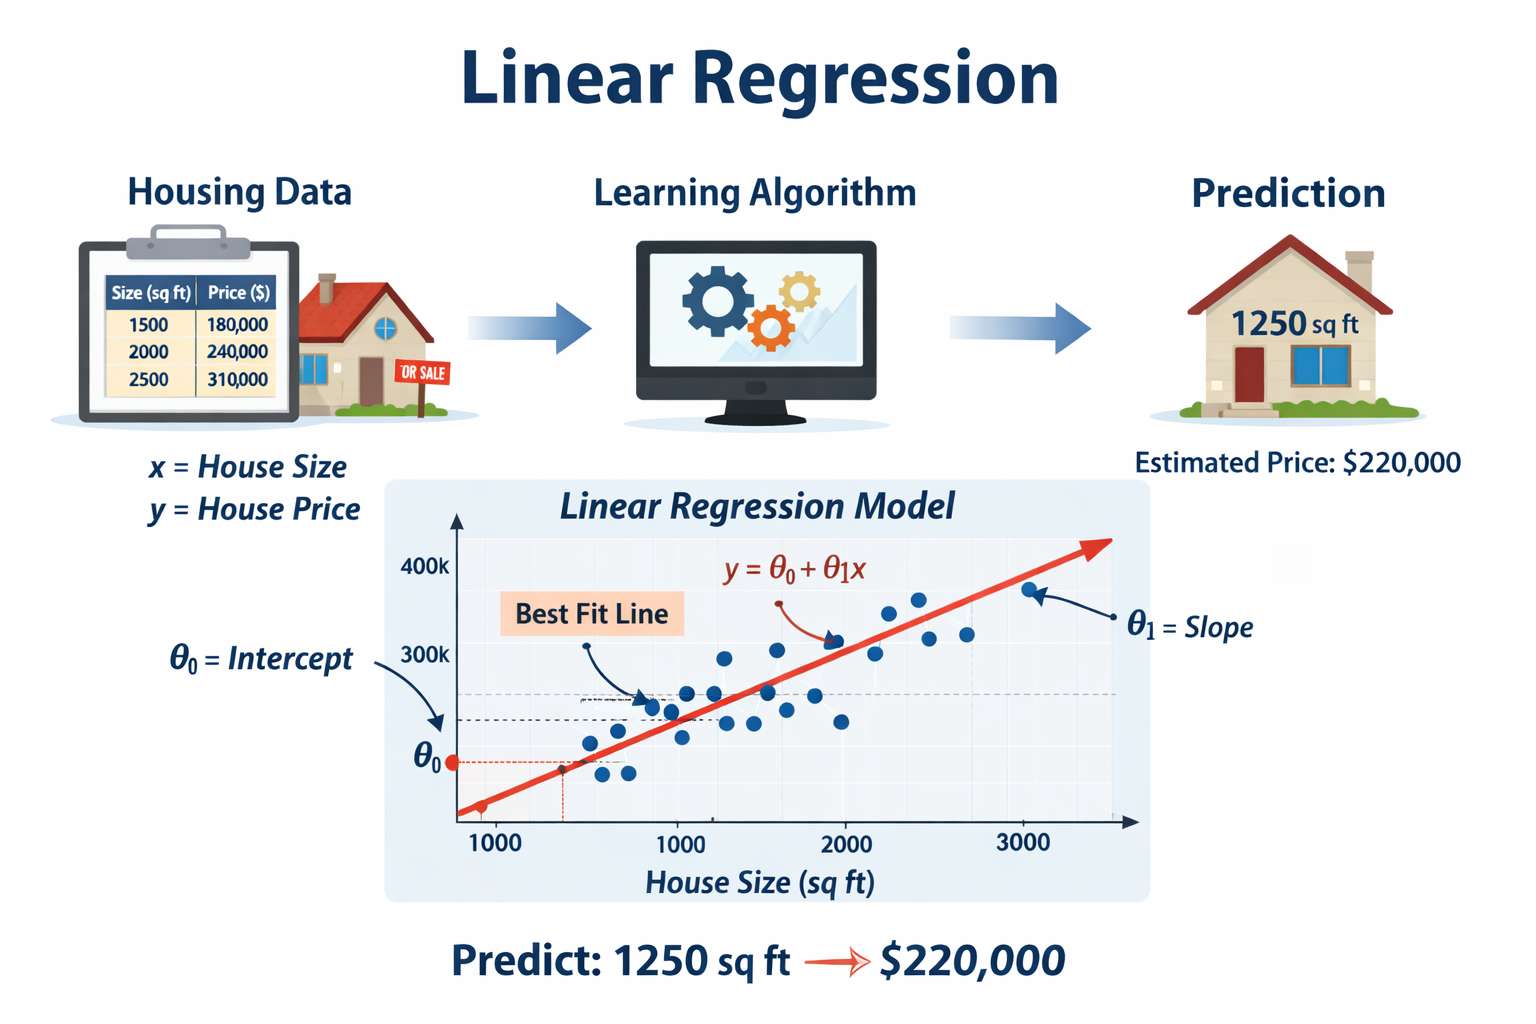
Example
Housing Price Prediction (Regression)
Predict the price of a house based on its size.
- Feature (x): House size (square feet)
- Output (y): Price (continuous value)
We are given historical data:
| Size (sq ft) | Price ($) |
|---|---|
| 1000 | 200000 |
| 1500 | 300000 |
| 2000 | 400000 |
The algorithm may:
- Fit a straight line (
Linear Regression) - Fit a quadratic curve (
Polynomial Regression)
Different models may produce different predictions.
Regression
│
├── 1. Linear Regression Family
│   │
│   ├── Simple Linear Regression
│   │   └── One feature → one output
│   │
│   ├── Multiple Linear Regression
│   │   └── Multiple features → one output
│   │
│   ├── Polynomial Regression
│   │   └── Adds nonlinear polynomial features
│   │
│   ├── Ridge Regression (L2)
│   │   └── Reduces overfitting using L2 regularization
│   │
│   ├── Lasso Regression (L1)
│   │   └── Performs feature selection using L1 regularization
│   │
│   └── Elastic Net
│       └── Combination of L1 + L2 regularization
│
├── 2. Tree-Based Regression
│   │
│   ├── Decision Tree Regressor
│   │   └── Splits data into regions
│   │
│   ├── Random Forest Regressor
│   │   └── Ensemble of decision trees
│   │
│   ├── Gradient Boosting Regressor
│   │   └── Sequential boosting of weak learners
│   │
│   ├── XGBoost Regressor
│   │   └── Optimized gradient boosting
│   │
│   ├── LightGBM Regressor
│   │   └── Fast large-scale boosting
│   │
│   └── CatBoost Regressor
│       └── Handles categorical features well
│
├── 3. Support Vector Regression (SVR)
│   │
│   ├── Linear SVR
│   ├── Polynomial Kernel SVR
│   └── Gaussian/RBF Kernel SVR
│
├── 4. Instance-Based Regression
│   │
│   └── K-Nearest Neighbors Regressor (KNN)
│       └── Predicts using nearby points
│
├── 5. Probabilistic Regression
│   │
│   ├── Bayesian Regression
│   ├── Gaussian Process Regression
│   └── Quantile Regression
│
├── 6. Neural Network Regression
│   │
│   ├── MLP Regressor
│   ├── Deep Neural Networks
│   ├── CNN Regression
│   ├── RNN/LSTM Regression
│   └── Transformer Regression
│
├── 7. Time Series Regression
│   │
│   ├── ARIMA
│   ├── SARIMA
│   ├── Prophet
│   ├── LSTM Forecasting
│   └── Transformer Forecasting
│
└── 8. Supporting Concepts
    │
    ├── Cost Functions
    │   ├── Mean Squared Error (MSE)
    │   ├── Root Mean Squared Error (RMSE)
    │   ├── Mean Absolute Error (MAE)
    │   └── Huber Loss
    │
    ├── Optimization
    │   ├── Gradient Descent
    │   ├── Stochastic Gradient Descent (SGD)
    │   ├── Mini-Batch GD
    │   └── Adam Optimizer
    │
    ├── Regularization
    │   ├── L1 Regularization
    │   ├── L2 Regularization
    │   ├── Elastic Net
    │   └── Dropout
    │
    ├── Feature Engineering
    │   ├── Scaling
    │   ├── Normalization
    │   ├── Polynomial Features
    │   └── PCA
    │
    └── Evaluation Metrics
        ├── R² Score
        ├── Adjusted R²
        ├── MSE
        ├── RMSE
        ├── MAE
        └── MAPE
1.2 Classification 🌌
Classification means predicting a
discrete categoryas output
- We train using past labeled examples.
- Only specific categories allowed as output (0 or 1)
Using One Feature
Breast Cancer Detection (Classification)
What is the probability this tumor is malignant?
- Feature: Tumor size
- Output: 0 or 1
- Malignant (1)
- Benign (0)
Multiple Features
More than one feature:
- Tumor size
- Age
- Clump thickness
- Uniformity of cell size
- Uniformity of cell shape
Multiple Output categories:
- 0 → No cancer
- 1 → Type 1 cancer
- 2 → Type 2 cancer
- 3 → Type 3 cancer
It is still classification because the output is from a finite set of categories.
The algorithm learns a decision boundary that separates categories.
Classification
│
├── 1. Linear Classifiers
│   │
│   ├── Logistic Regression
│   │   ├── Binary Classification
│   │   ├── Multiclass Classification
│   │   └── Uses Sigmoid / Softmax
│   │
│   ├── Perceptron
│   │   └── Basic neural classifier
│   │
│   ├── Linear SVM
│   │   └── Maximum margin classifier
│   │
│   └── SGD Classifier
│       └── Efficient for large datasets
│
├── 2. Probabilistic Classifiers
│   │
│   ├── Naive Bayes
│   │   │
│   │   ├── Gaussian Naive Bayes
│   │   ├── Multinomial Naive Bayes
│   │   ├── Bernoulli Naive Bayes
│   │   └── Complement Naive Bayes
│   │
│   └── Bayesian Networks
│
├── 3. Support Vector Machines (SVM)
│   │
│   ├── Linear Kernel SVM
│   ├── Polynomial Kernel SVM
│   ├── Gaussian/RBF Kernel SVM
│   └── One-vs-All / One-vs-One Multiclass SVM
│
├── 4. Tree-Based Classification
│   │
│   ├── Decision Tree Classifier
│   │   └── Rule-based splitting
│   │
│   ├── Random Forest Classifier
│   │   └── Ensemble of trees
│   │
│   ├── Extra Trees Classifier
│   │   └── Extremely randomized trees
│   │
│   ├── Gradient Boosting
│   │   ├── AdaBoost
│   │   ├── XGBoost
│   │   ├── LightGBM
│   │   └── CatBoost
│   │
│   └── Histogram Gradient Boosting
│
├── 5. Instance-Based Learning
│   │
│   └── K-Nearest Neighbors (KNN)
│       └── Classifies using nearest points
│
├── 6. Neural Network Classifiers
│   │
│   ├── Multi-Layer Perceptron (MLP)
│   │
│   ├── Convolutional Neural Networks (CNN)
│   │   └── Images / Computer Vision
│   │
│   ├── Recurrent Neural Networks (RNN)
│   │   └── Sequential data
│   │
│   ├── LSTM / GRU
│   │   └── Long-term sequence learning
│   │
│   └── Transformers
│       ├── BERT
│       ├── GPT
│       └── Vision Transformers (ViT)
│
├── 7. Ensemble Methods
│   │
│   ├── Bagging
│   ├── Boosting
│   ├── Stacking
│   ├── Voting Classifiers
│   └── Blending
│
├── 8. Specialized Classification
│   │
│   ├── Multi-Label Classification
│   ├── Imbalanced Classification
│   ├── Hierarchical Classification
│   ├── One-Class Classification
│   └── Ordinal Classification
│
├── 9. Supporting Concepts
│   │
│   ├── Activation Functions
│   │   ├── Sigmoid
│   │   ├── Softmax
│   │   ├── ReLU
│   │   └── Tanh
│   │
│   ├── Loss Functions
│   │   ├── Binary Cross Entropy
│   │   ├── Categorical Cross Entropy
│   │   ├── Hinge Loss
│   │   └── Focal Loss
│   │
│   ├── Regularization
│   │   ├── L1 / L2
│   │   ├── Dropout
│   │   └── Early Stopping
│   │
│   ├── Feature Engineering
│   │   ├── Scaling
│   │   ├── Encoding
│   │   ├── Feature Selection
│   │   └── PCA
│   │
│   └── Class Imbalance Handling
│       ├── SMOTE
│       ├── Oversampling
│       ├── Undersampling
│       └── Class Weights
│
└── 10. Evaluation Metrics
│
├── Accuracy
├── Precision
├── Recall
├── F1 Score
├── ROC-AUC
├── PR-AUC
├── Confusion Matrix
├── Log Loss
└── Matthews Correlation Coefficient (MCC)
2. Unsupervised Learning
There are no labeled input. The system tries to find structure in the data.
Goal: discover hidden structure in data.
Algorithms studied:
- K-Means Clustering
- Principal Component Analysis (PCA) for dimensionality reduction
- Anomaly Detection
Training set:
Unsupervised learning uses unlabeled data:
- No labels
- No correct answers
- No predefined categories
Where:
- is the input (features)
- There are no y labels.
Goal
Discover hidden structure in the data.
"Here is the data. Can you find structure in it?"
We do not tell the algorithm what the correct output is.
We ask it to find patterns on its own.
- Discovers hidden structure
- Common task: Clustering
- Advanced example: Cocktail Party Problem
2.1 Clustering
The algorithm automatically groups similar data points together.
- Used to find patterns
We are not told:
- How many groups exist
- What the groups represent
- Which example belongs to which group
The algorithm discovers that on its own.
Example
- Given market data Identify patterns in buying behavior
- Given news articles data find topics
- Given Data Centers logs find machines that frequently work together
- Given Social Network data find groups or communities
- Given customer data find Market Segmentation
- Given Astronomical data find galaxies
Clustering
│
├── 1. Partition-Based Clustering
│   │
│   ├── K-Means
│   │   ├── Most popular clustering algorithm
│   │   ├── Distance-based
│   │   └── Requires choosing K clusters
│   │
│   ├── K-Medoids
│   │   └── More robust to outliers
│   │
│   └── Mini-Batch K-Means
│       └── Faster for large datasets
│
├── 2. Hierarchical Clustering
│   │
│   ├── Agglomerative Clustering
│   │   ├── Bottom-up approach
│   │   └── Merge closest clusters
│   │
│   ├── Divisive Clustering
│   │   ├── Top-down approach
│   │   └── Split clusters recursively
│   │
│   └── Dendrograms
│       └── Tree visualization of clusters
│
├── 3. Density-Based Clustering
│   │
│   ├── DBSCAN
│   │   ├── Detects arbitrary shapes
│   │   ├── Handles noise well
│   │   └── Density-based grouping
│   │
│   ├── HDBSCAN
│   │   └── Hierarchical DBSCAN
│   │
│   └── OPTICS
│       └── Handles varying densities
│
├── 4. Probabilistic Clustering
│   │
│   ├── Gaussian Mixture Models (GMM)
│   │   ├── Soft clustering
│   │   └── Uses probability distributions
│   │
│   └── Bayesian Gaussian Mixtures
│
├── 5. Grid-Based Clustering
│   │
│   ├── STING
│   ├── CLIQUE
│   └── WaveCluster
│
├── 6. Spectral & Graph Clustering
│   │
│   ├── Spectral Clustering
│   │   └── Uses graph eigenvectors
│   │
│   ├── Community Detection
│   │   ├── Louvain Method
│   │   └── Label Propagation
│   │
│   └── Graph-Based Clustering
│
├── 7. Neural Clustering
│   │
│   ├── Self-Organizing Maps (SOM)
│   ├── Deep Clustering
│   ├── Autoencoder Clustering
│   └── Contrastive Clustering
│
├── 8. Fuzzy Clustering
│   │
│   └── Fuzzy C-Means
│       └── Data point can belong to multiple clusters
│
├── 9. Specialized Clustering
│   │
│   ├── Time Series Clustering
│   ├── Spatial Clustering
│   ├── Image Segmentation Clustering
│   ├── Document Clustering
│   └── Topic Modeling
│       ├── LDA
│       └── NMF
│
├── 10. Distance Metrics
│   │
│   ├── Euclidean Distance
│   ├── Manhattan Distance
│   ├── Cosine Similarity
│   ├── Minkowski Distance
│   └── Mahalanobis Distance
│
├── 11. Dimensionality Reduction Often Used Before Clustering
│   │
│   ├── PCA
│   ├── t-SNE
│   ├── UMAP
│   └── ICA
│
├── 12. Cluster Evaluation Metrics
│   │
│   ├── Silhouette Score
│   ├── Davies-Bouldin Index
│   ├── Calinski-Harabasz Score
│   ├── Inertia (WCSS)
│   └── Adjusted Rand Index (ARI)
│
└── 13. Common Real-World Applications
    │
    ├── Customer Segmentation
    ├── Recommendation Systems
    ├── Fraud Detection
    ├── Anomaly Detection
    ├── Social Network Analysis
    ├── Image Compression
    ├── Market Basket Analysis
    └── Document Grouping
2.2 Blind Source Separation 🧮
Separating mixed signals into original independent components.
The Cocktail Party Problem
Given only the mixed recordings:
- Detect that multiple sources exist
- Separate them into independent signals
- Recover the original voices
No labels are given:
- We do not tell the algorithm what each voice sounds like
- It discovers structure in the signal
Separate the original voices from mixed signals.
Difference Between Supervised and Unsupervised Learning
| Aspect | Supervised Learning | Unsupervised Learning |
|---|---|---|
| Data | Labeled data (input + correct output) | Unlabeled data (input only) |
| Goal | Learn mapping from input → output | Discover hidden structure or patterns |
| Output Type | Continuous (regression) or discrete (classification) | Clusters, groups, latent structure |
| Example Problem | House price prediction | Customer segmentation |
| Example Problem | Spam detection | Grouping news articles |
| Human Guidance | Requires correct answers during training | No correct answers provided |
| Typical Tasks | Regression, Classification | Clustering, Dimensionality Reduction |
| Evaluation | Compare predictions with true labels | Evaluate structure quality (e.g., cohesion, separation) |
| Use Case | When you know what you want to predict | When you want to explore unknown patterns |
3. Special Applications 💠
Several practical ML systems were discussed:
- Recommender Systems
- Large-scale machine learning
- Parallel and distributed learning
- Computer vision using sliding window object detection
These show how ML is applied in real-world systems.
Building Machine Learning Systems
How to make ML systems work in practice.
Important concepts:
Bias vs Variance
- High bias → underfitting
- High variance → overfitting
Regularization helps control variance.
Evaluating Learning Algorithms
Proper evaluation is essential.
Data is usually split into:
- Training set
- Cross-validation set
- Test set
Common evaluation metrics:
- Precision
- Recall
- F1 Score
Debugging and Improving ML Systems
Tools discussed for diagnosing problems:
- Learning curves
- Error analysis
- Ceiling analysis
These techniques help answer:
What should we work on next to improve the system?
Machine Learning Algos
All Algos
Machine Learning
│
├── 1. Supervised Learning
│   │
│   ├── Regression
│   │   ├── Linear Regression
│   │   ├── Polynomial Regression
│   │   ├── Ridge Regression
│   │   ├── Lasso Regression
│   │   ├── Elastic Net
│   │   ├── Decision Tree Regressor
│   │   ├── Random Forest Regressor
│   │   ├── XGBoost Regressor
│   │   └── Support Vector Regression (SVR)
│   │
│   ├── Classification
│   │   ├── Logistic Regression
│   │   ├── Naive Bayes
│   │   ├── K-Nearest Neighbors (KNN)
│   │   ├── Support Vector Machine (SVM)
│   │   ├── Decision Trees
│   │   ├── Random Forest
│   │   ├── Gradient Boosting
│   │   │   ├── XGBoost
│   │   │   ├── LightGBM
│   │   │   └── CatBoost
│   │   ├── Neural Networks
│   │   └── Deep Learning
│   │       ├── CNN
│   │       ├── RNN
│   │       ├── LSTM
│   │       ├── GRU
│   │       └── Transformers
│   │
│   └── Ensemble Methods
│       ├── Bagging
│       ├── Boosting
│       └── Stacking
│
├── 2. Unsupervised Learning
│   │
│   ├── Clustering
│   │   ├── K-Means
│   │   ├── Hierarchical Clustering
│   │   ├── DBSCAN
│   │   ├── Mean Shift
│   │   └── Gaussian Mixture Models (GMM)
│   │
│   ├── Dimensionality Reduction
│   │   ├── PCA
│   │   ├── t-SNE
│   │   ├── UMAP
│   │   ├── ICA
│   │   └── Autoencoders
│   │
│   ├── Association Rule Learning
│   │   ├── Apriori
│   │   └── FP-Growth
│   │
│   └── Anomaly Detection
│       ├── Isolation Forest
│       ├── One-Class SVM
│       └── Local Outlier Factor
│
├── 3. Reinforcement Learning
│   │
│   ├── Value-Based Methods
│   │   ├── Q-Learning
│   │   └── Deep Q Networks (DQN)
│   │
│   ├── Policy-Based Methods
│   │   ├── Policy Gradient
│   │   └── REINFORCE
│   │
│   ├── Actor-Critic Methods
│   │   ├── A2C
│   │   ├── A3C
│   │   └── PPO
│   │
│   └── Model-Based RL
│
├── 4. Semi-Supervised Learning
│   ├── Self-Training
│   ├── Label Propagation
│   └── Pseudo Labeling
│
├── 5. Self-Supervised Learning
│   ├── Contrastive Learning
│   ├── SimCLR
│   ├── MoCo
│   └── Masked Language Models
│
└── 6. Generative AI
│
├── Generative Models
│   ├── GANs
│   ├── VAEs
│   ├── Diffusion Models
│   └── Normalizing Flows
│
├── Large Language Models
│   ├── GPT
│   ├── BERT
│   ├── T5
│   └── Llama
│
└── Multimodal Models
├── CLIP
├── Flamingo
└── GPT-4o