Graphics
Plotting
- Plots Y against X
Line Specification
Line style
'- '	 Solid line (default)
'--'   Dashed line
':'	 Dotted line
'-.'	 Dash-dot line
Marker symbol
 '.'	 Point
 'x'	 Cross
 '+'	 Plus sign
 'o'	 Circle
 '*'	 Asterisk

 '^'	Upward-pointing triangle
 'v'	Downward-pointing triangle
 '>'	Right-pointing triangle
 '<'	Left-pointing triangle

'square' or 's'  Square
'diamond' or 'd'  Diamond
'pentagram' or 'p' Five-pointed star (pentagram)
'hexagram' or 'h'  Six-pointed star (hexagram)
Color
r	Red
g	Green
b	Blue
c	Cyan
m	Magenta
y	Yellow
k	Black
w	White
Plotting
    plot(x,y)
    plot(x,y, "r  *") // plot red * no line

    hold on      // plot on same Axis as before
    hold off     // plot on different axis

    clf       // clear figure
    close     // close figure

    figure(1): plot(x,y) // save a figure

    subplot(n,m,o) // divide plot in nXm grid and access o element
    subplot(1,2,1) // divide plot in 1*2 grid and draw in first subplot

    plot(Vector)  // auto plot Vector on Y axis
    plot(x,y,"red--o", "LineWidth", 4)
Limit
    xlim([n,n])   // limit x range between n & m
    ylim([n,m])   // limit y range between n & m
Plot Matrix:
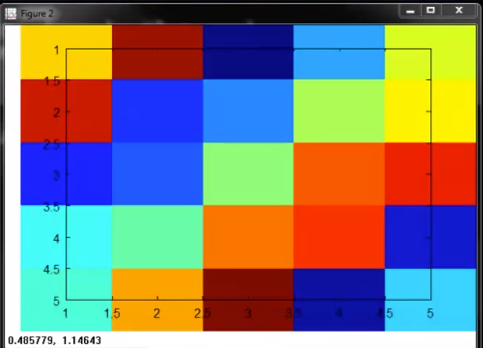
Color Plot
   A = magic(5)
   imagesc(A)
Result:
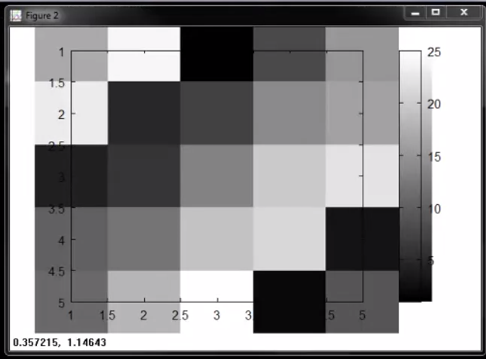
Grey Scale Plot
 A = magic(5)
 imagesc(A), colorbar, colormap grey
Result:
Legend:
    title('TITLE OF PLOT')   // Title
    axis([x1, x2, y,, y2])   // set axis range to x,. x2 & y1y2
    xlabel('X axis Label')   // X Label
    ylabel('Y axis Label')   // Y Label
    legend('plot1','plot2')  // Legend
    grid on                   // Grid enable
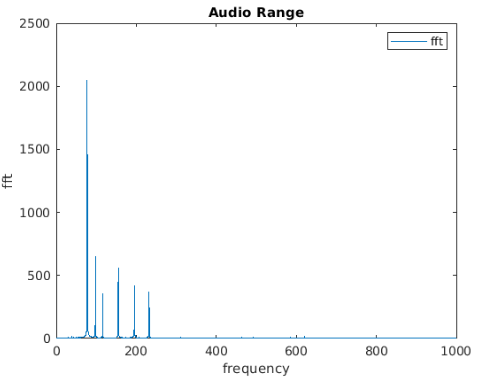
Example: FFT Plot
    plot(f, yfft)
    xlim([0,1000])
    title("Audio Range")
    xlabel("frequency")
    ylabel("fft")
    legend("fft")
Result:
Export Figure:
print -dpng "<image name>.png"